

Analyzing Mortality Statistics in Winnipeg: Trends, Causes, and Interventions
Key Insights
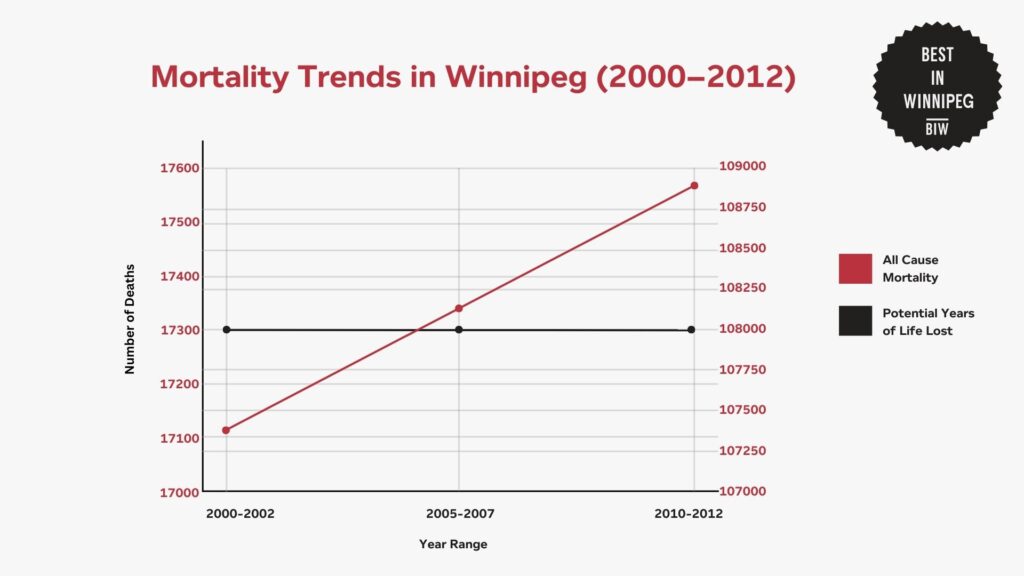
- Statistics Canada reports that Winnipeg experienced a rise in all-cause mortality, increasing from 17,115 deaths between 2000–2002 to 17,565 between 2010–2012, a 2.63% increase.
- The same report shows that potential years of life lost (PYLL) in Winnipeg consistently hovered around 108,000 annually, reflecting the persistent impact of premature deaths on the population.
- The City of Winnipeg illustrated that In 2022, Winnipeg reported a significant increase in traffic collisions, rising to 20,618 incidents from 14,558 in 2021, marking a 41.6% increase.
- Data from Statistics Canada shows that Winnipeg’s mortality rate during 2010–2012 was 7.2 deaths per 1,000 population, higher than the national average of 6.5.
- Canada Crime Index data shows that neighborhoods like Lord Selkirk Park reported violent crime rates 50% higher than Winnipeg’s citywide average of 2,075 incidents per 100,000 people.
Winnipeg’s mortality statistics reveal significant trends in public health and safety over the past decades.
Statistics Canada reports that from 2000 to 2012, Winnipeg reported a gradual rise in all-cause mortality, with numbers increasing from 17,115 deaths between 2000 and 2002 to 17,565 between 2010 and 2012. This shows an increase rate of 2.63%.
Meanwhile, potential years of life lost (PYLL) hovered around 108,000 annually, underscoring the persistent impact of premature deaths on the population.
Data from another report by Statistics Canada also shows that Winnipeg recorded 45 homicides in 2023, marking one of the highest annual totals in recent years.
Furthermore, data from Homicide Canada suggests Winnipeg is on track to surpass 40 annual homicides for the sixth consecutive year, highlighting the city’s ongoing struggle with violent crime.
Statistics on Collisions in Winnipeg
The City of Winnipeg provides insights into the number of reported collisions in Winnipeg.
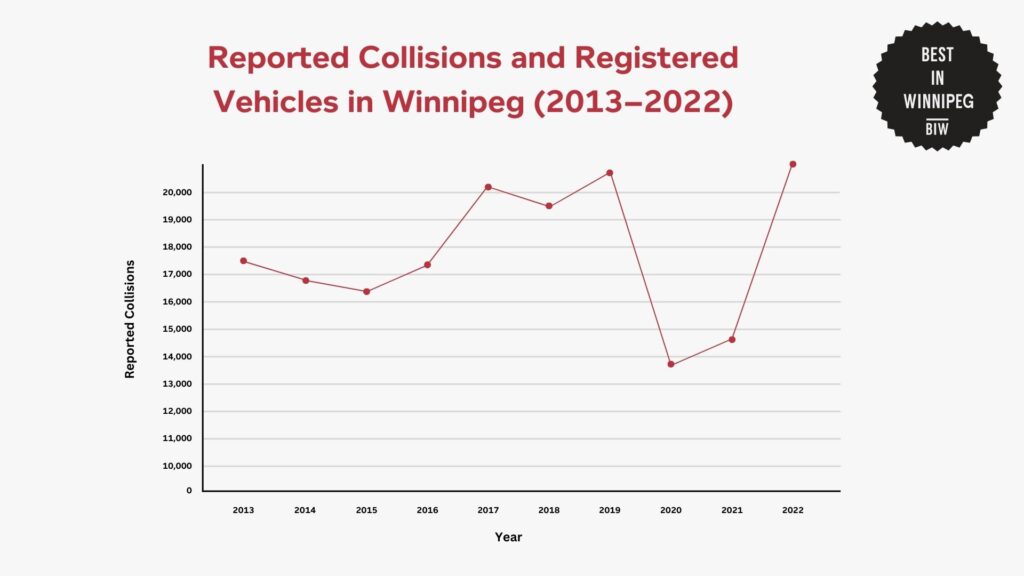
In 2022, Winnipeg experienced a notable increase in traffic collisions. The total number of reported collisions rose to 20,618, up from 14,558 in 2021, marking a 41.6% increase.
The significant rise in reported collisions in 2022 may be attributed to several factors, including an increase in vehicular traffic as pandemic restrictions eased and a growing number of registered vehicles.
This upward trend aligns with the increase in registered vehicles in the city. In 2022, there were 588,120 registered vehicles, resulting in a collision rate of 35.06 per 1,000 vehicles, a 39.9% increase from the 2021 rate of 25.06 per 1,000 vehicles.
Regional Analysis
An analysis of mortality rates across various Canadian Census Metropolitan Areas (CMAs) reveals notable differences.
The data indicates that during the 2010–2012 period, Winnipeg reported an average annual mortality rate of 7.2 deaths per 1,000 population.
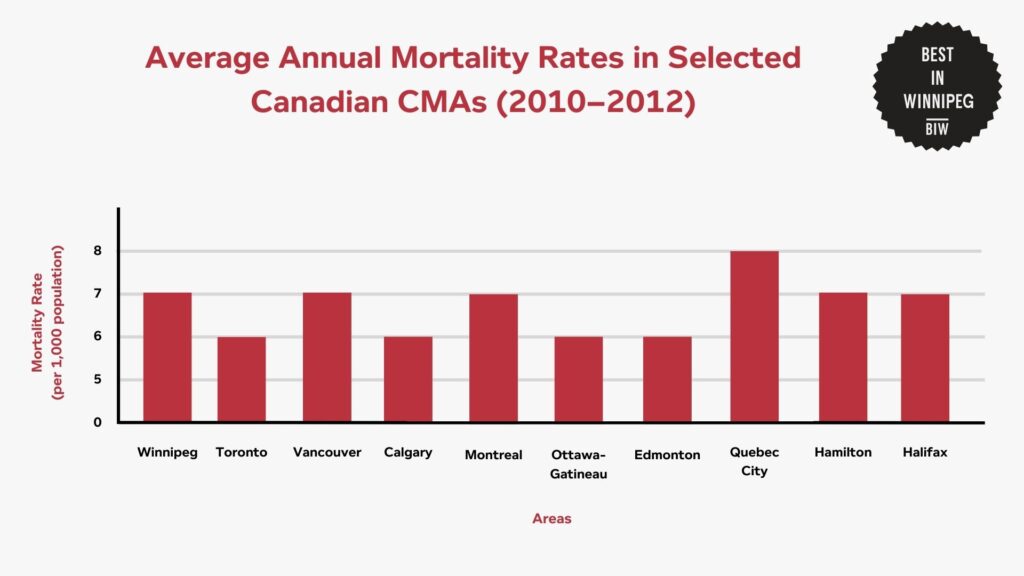
The data illustrates that Winnipeg’s mortality rate of 7.2 per 1,000 population is higher than the national average of 6.5 during the 2010–2012 period.
This places Winnipeg among the CMAs with elevated mortality rates, alongside Montreal and Quebec City.
Factors contributing to these regional differences may include variations in healthcare access, socioeconomic conditions, and demographic compositions.
City-Level Trends
Crime rates in Winnipeg exhibit significant variation across different neighborhoods, highlighting areas with elevated safety concerns. Data from the Canada Crime Index identifies the top 10 neighborhoods with the highest crime rates in 2024.
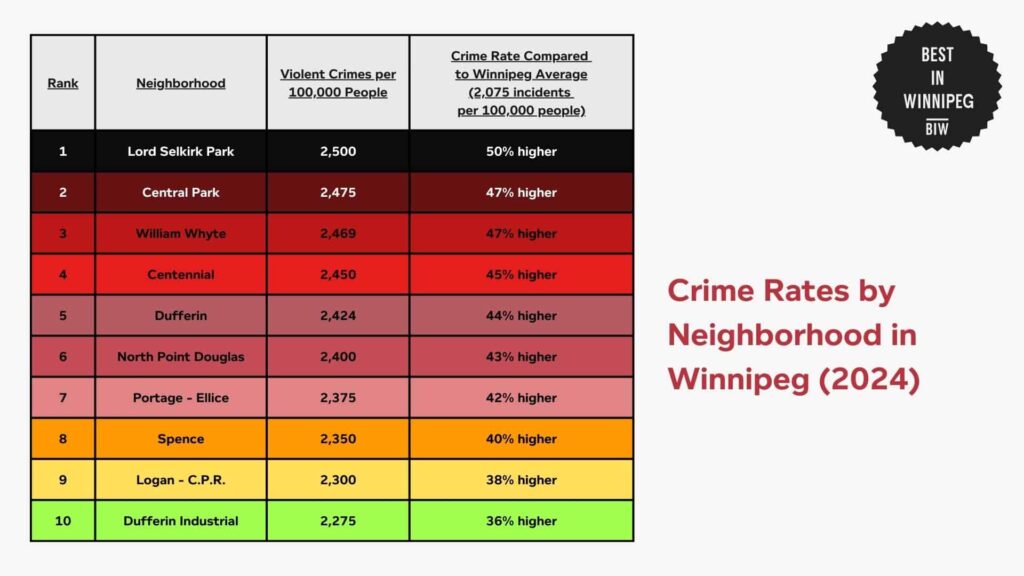
The data reveals that neighborhoods such as Lord Selkirk Park (2,500), Central Park (2,475), and William Whyte (2,469) experience violent crime rates significantly higher than Winnipeg’s citywide average of 2,075 incidents per 100,000 people.
These elevated rates can be attributed to challenges such as socioeconomic disparities, higher population densities, and limited access to community resources.
Demographic Breakdown of Mortality Rates in Manitoba
Data from the Manitoba Health Provincial Information Management and Analytics Report reveals valuable insights into the province’s population structure and dynamics.
Premature Mortality
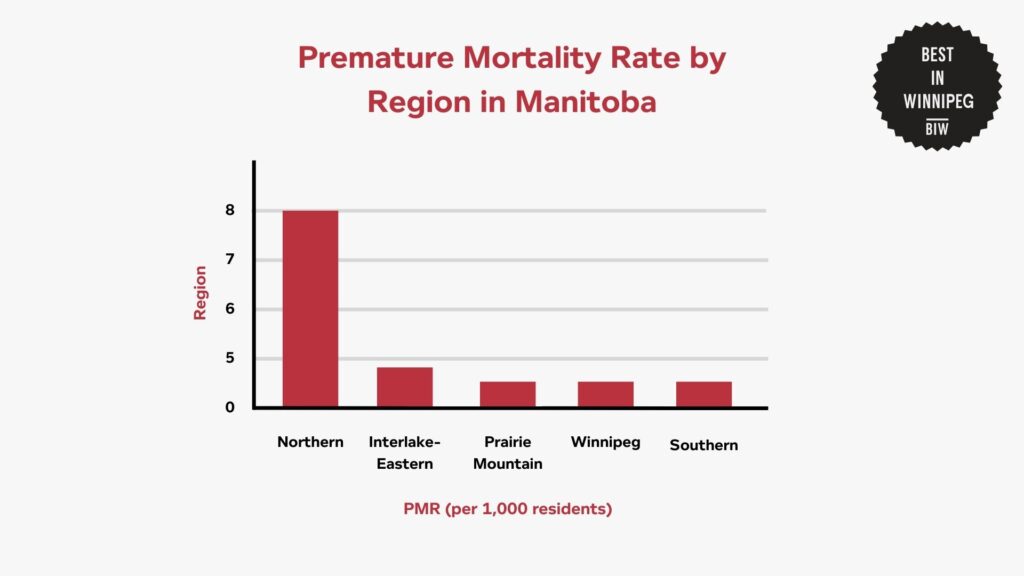
The premature mortality rate (PMR) in Manitoba, defined as deaths before the age of 75, was 3.4 deaths per 1,000 residents between 2015 and 2020.
The Northern Health Region reported the highest PMR at 7.6, over double the provincial average. Winnipeg’s PMR was slightly below the average at 3.0.
The high PMR in the Northern Health Region suggests a need for targeted healthcare improvements, while Winnipeg’s slightly lower PMR reflects relatively better access to healthcare.
Cancer and circulatory diseases, which account for 52% of premature deaths, underscore the importance of preventive care and early detection programs.
Infant Mortality
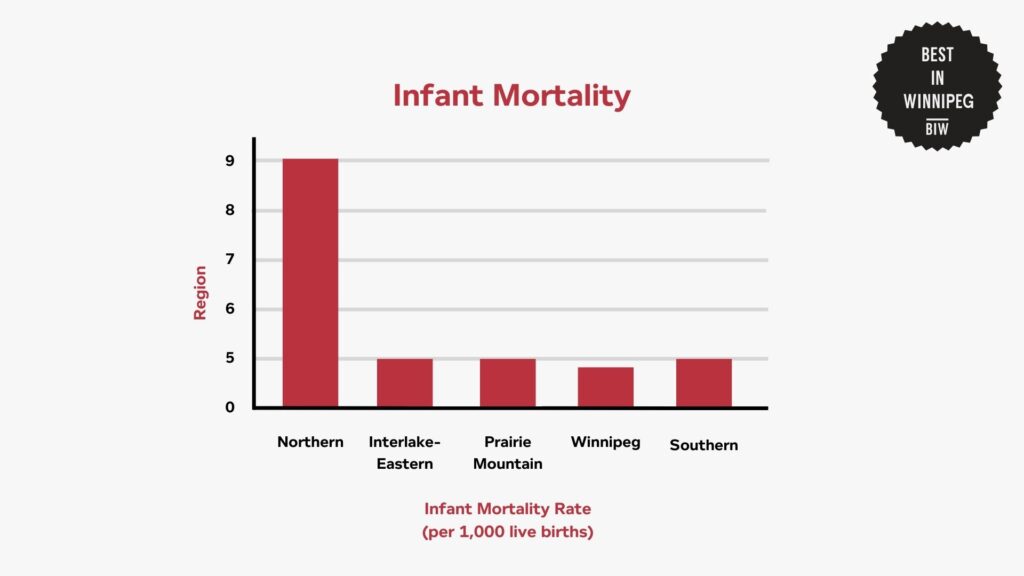
From 2015 to 2020, Manitoba reported an average infant mortality rate of 5.1 deaths per 1,000 live births, with the Northern Health Region showing the highest rate at 9.2.
Winnipeg’s rate was below the provincial average at 4.4. The disparity between Winnipeg and the Northern Health Region reflects differences in prenatal care, maternal health services, and socioeconomic conditions.
Injury-Related Mortality
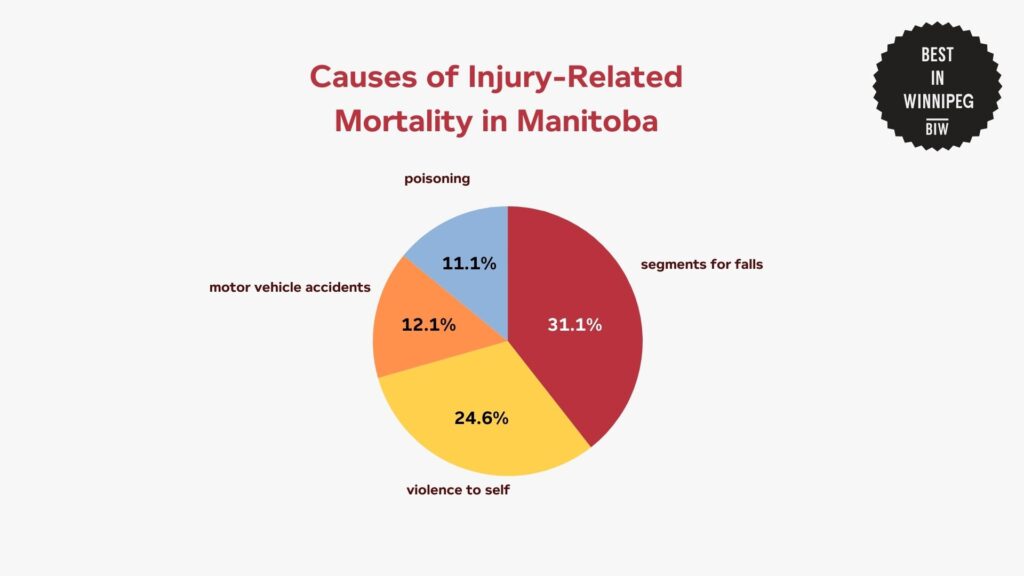
Injury-related deaths accounted for 694 deaths in 2019–2020, with a provincial rate of 0.51 per 1,000 residents. Winnipeg’s rate was below average at 0.42, while the Northern Health Region recorded a significantly higher rate at 1.69.
The lower injury-related mortality rate in Winnipeg reflects better access to emergency medical care and safety infrastructure.
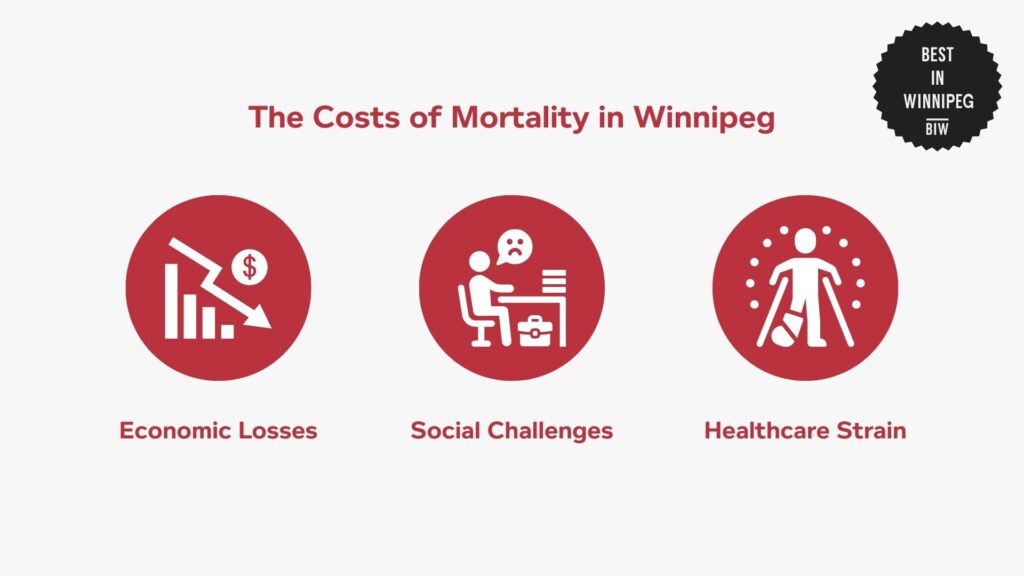
Costs and Consequences of Rising Mortality Rates
High mortality rates in Winnipeg bring forth a range of economic, social, and healthcare challenges that affect both individuals and the broader community.
Economic Impact
High mortality rates in Winnipeg bring forth a range of economic, social, and healthcare challenges that affect both individuals and the broader community.
On the economic side, premature deaths from preventable causes such as chronic diseases and injuries result in lost productivity and increased healthcare spending.
A study by Diabetes Canada estimates that complications from diabetes, a leading contributor to mortality, impose millions of dollars in direct and indirect costs on Manitoba’s healthcare system annually.
In Winnipeg, where diabetes prevalence is higher in underserved neighborhoods, the economic burden disproportionately affects low-income communities.
Furthermore, costs are also compounded by the expense of emergency responses, rehabilitation, and insurance claims.
Social Consequences
High mortality rates have profound social implications for Winnipeg’s residents. Communities experiencing elevated premature deaths often face reduced workforce participation and increased emotional and financial strain on families.
The Canada Crime Index shows that neighborhoods like Lord Selkirk Park and Central Park, which report higher crime and mortality rates, face additional challenges in accessing resources and maintaining social cohesion.
Disparities in mortality also exacerbate social inequities, as vulnerable populations such as Indigenous Peoples and low-income groups bear a disproportionate burden.
Social Consequences
Winnipeg’s healthcare system is under pressure due to the high prevalence of preventable deaths.
Data from the Manitoba Health Provincial Information Management and Analytics Report shows that conditions like cancer and circulatory diseases account for over 50% of premature mortality in Manitoba, with Winnipeg contributing significantly here.
Hospitals and clinics are often overwhelmed by managing these diseases, limiting their ability to address other health needs.
Additionally, injury-related deaths, which are higher in Winnipeg than in other urban areas in the province, strain emergency and trauma care services.
Interventions and Solutions
Winnipeg has implemented a range of initiatives aimed at reducing mortality rates and improving public health outcomes.
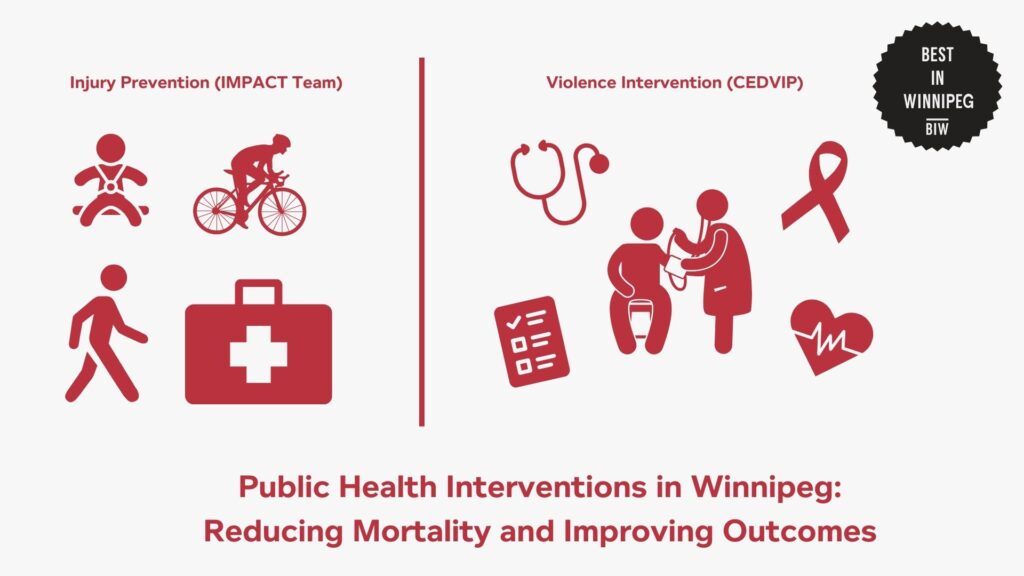
The Winnipeg Regional Health Authority (WRHA) established the IMPACT team, which collaborates with public health officials, government agencies, and community organizations to address injury risks.
The program emphasizes areas such as preventing falls in older adults, promoting safe cycling, and ensuring child occupant protection.
To address violence-related injuries, the Community-Emergency Department Violence Intervention Program (CEDVIP) was launched, providing wraparound care to youths and young adults aged 14 to 29 who present to emergency departments.
In its first five months, CEDVIP assisted nearly 200 individuals, decreasing their risk of continued physical harm while reducing patient traffic to HSC Winnipeg’s emergency department.
Projections
According to the Office of the Superintendent of Financial Institutions, life expectancy in Canada is anticipated to rise over the coming decades. This national trend suggests a gradual decline in mortality rates, which is likely to be reflected in Winnipeg as well.
Locally, the Winnipeg Regional Health Authority (WRHA) has outlined strategic priorities in its 2023–2028 Strategic Plan, focusing on enhancing healthcare services and addressing social determinants of health.
Continuous monitoring and tailored public health strategies will be essential to address the unique challenges and opportunities within the community.
References
- Canada Statistics. (n.d.). Table 13-10-0741-01: Mortality statistics, by selected causes of death and age group, Canada. Retrieved from https://www150.statcan.gc.ca/t1/tbl1/en/tv.action?pid=1310074101
- Canada Statistics. (n.d.). Table 35-10-0071-01: Police-reported crime statistics in Canada. Retrieved from https://www150.statcan.gc.ca/t1/tbl1/en/tv.action?pid=3510007101
- Homicide Canada. (n.d.). Winnipeg crime statistics and homicide reports. Retrieved from https://homicidecanada.com/
- City of Winnipeg. (2022). Annual Collision Report 2022. Retrieved from https://legacy.winnipeg.ca/publicworks/transportation/pdf/AnnualCollisionReport_2022.pdf
- Canada Crime Index. (n.d.). Winnipeg crime rate. Retrieved from https://canadacrimeindex.com/winnipeg-crime-rate/#google_vignette
- Manitoba Health. (2021). Annual statistics 2020–2021. Retrieved from https://www.gov.mb.ca/health/annstats/as2021.pdf
- Diabetes Canada. (n.d.). Chronic disease prevention and diabetes management. Retrieved from https://www.diabetes.ca/
- Winnipeg Regional Health Authority (WRHA). (n.d.). Injury prevention program. Retrieved from https://wrha.mb.ca/public-health/service/injury-prevention/?utm_source=chatgpt.com
- Manitoba Government. (n.d.). Community-Emergency Department Violence Intervention Program (CEDVIP). Retrieved from https://news.gov.mb.ca/news/?item=50224&utm_source=chatgpt.com
- Office of the Superintendent of Financial Institutions (OSFI). (n.d.). Mortality projections for social security programs in Canada: Actuarial study No. 22. Retrieved from https://www.osfi-bsif.gc.ca/en/oca/actuarial-reports/mortality-projections-social-security-programs-canada-actuarial-study-no-22
- Winnipeg Regional Health Authority (WRHA). (n.d.). 2023–2028 strategic plan. Retrieved from https://wrha.mb.ca/theplan/