

Winnipeg Salary Statistics: Trends, Disparities, and Future Outlook
Key Insights
- The average annual salary in Winnipeg is $51,031, equivalent to $24.53 per hour, according to ZipRecruiter.
- A contrasting figure from Nationwide Visas estimates the average salary in Winnipeg to be $58,010, a variance of $6,979.
- Top-paying professions in Winnipeg include Neurologist ($287,564), Owner Operator Truck Driver ($250,185), and CEO ($151,981), highlighting strong demand in healthcare, logistics, and business leadership.
- Data from the 2001 census data shows that neighborhoods like Tuxedo and Wellington Crescent report average household incomes exceeding $100,000, while Central Park and Centennial show averages below $25,000.
- The Canadian Centre for Policy Alternatives (CCPA) reports that men earn an average hourly wage of $27, while women earn only $23.
Winnipeg’s job market reflects a diverse economic landscape, with salaries varying significantly across industries, occupations, and experience levels.
According to ZipRecruiter, the average annual salary in Winnipeg is $51,031 (in CAD), equating to approximately $24.53 per hour, $981 per week, or $4,252 per month.
Meanwhile, Nationwide Visas estimates Winnipeg’s average annual salary is $58,010, which shows a variance of $6,979.
Salaries typically range between $38,750 at the 25th percentile and $61,750 at the 75th percentile, emphasizing the influence of job roles and seniority on earnings.
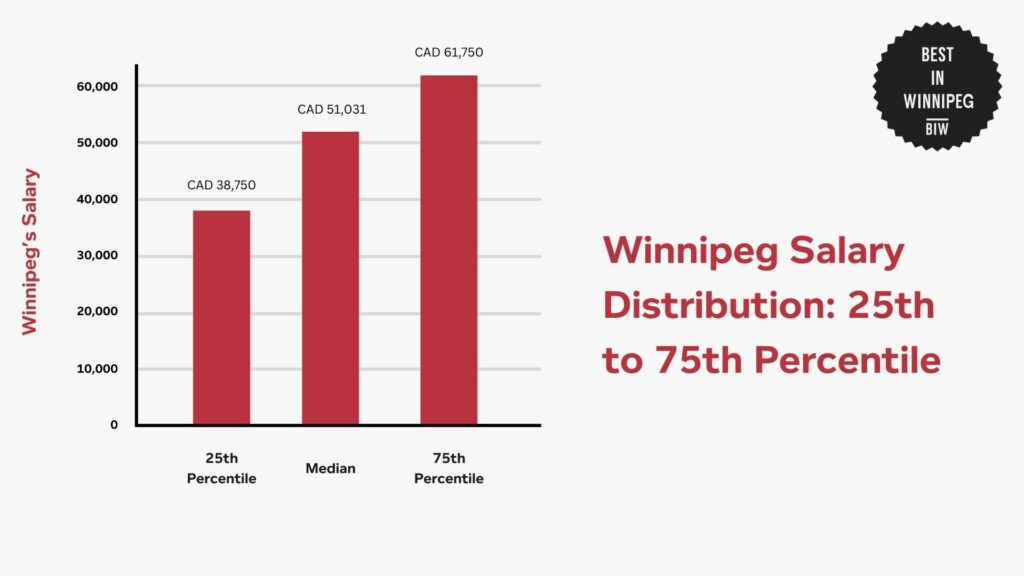
The chart demonstrates the variability in Winnipeg’s salaries, with a noticeable gap between the lower and upper percentiles. This range reflects the influence of factors such as education, experience, and industry specialization on income levels.
Highest Paying Jobs in Winnipeg
Data from ZipRecruiter highlights Winnipeg’s diverse salary opportunities, particularly in specialized fields.
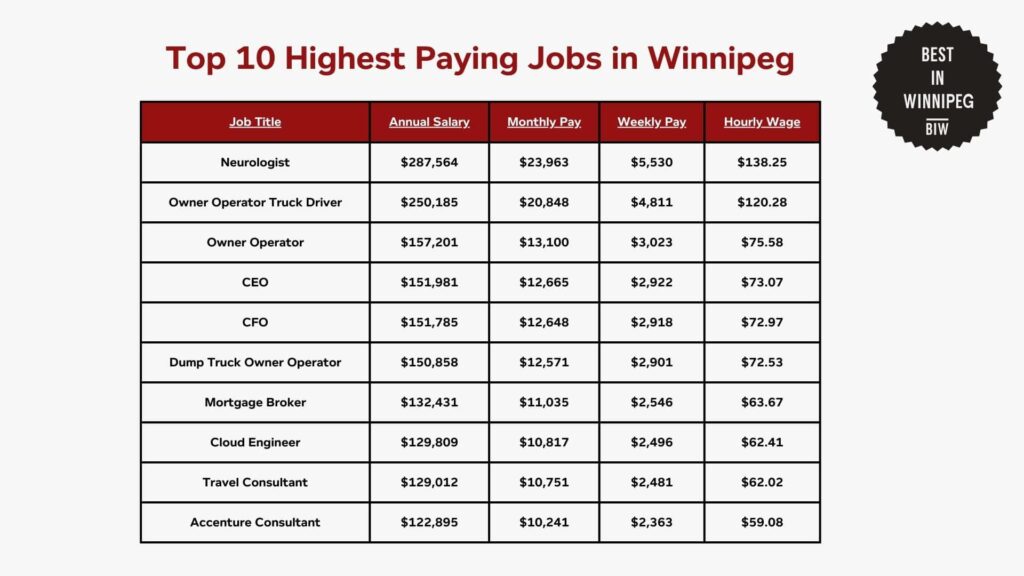
Neurologists top the list with an impressive annual salary of $287,564, showcasing the high demand and value placed on medical professionals.
Similarly, roles in logistics and transportation, such as Owner Operator Truck Drivers and Dump Truck Operators, command substantial incomes due to the critical nature of these jobs in regional supply chains.
Regional Comparison of Salaries in Canada
According to data from Nationwide Visas, the average annual salary in Manitoba is $58,010.
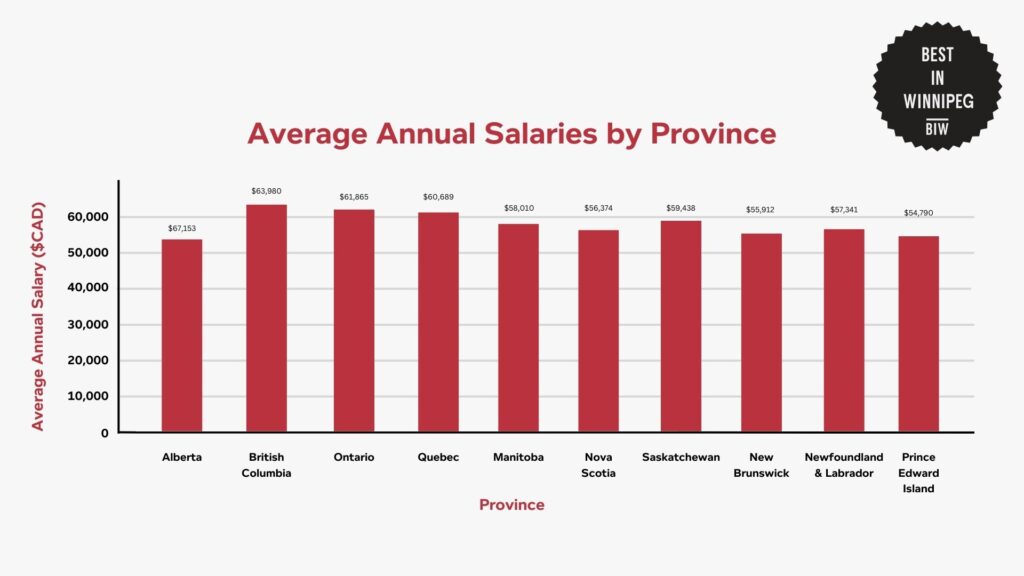
This figure positions Manitoba below provinces like Alberta, with an average salary of $67,153, and British Columbia, at $63,980. However, it is comparable to Quebec’s average of $60,689 and surpasses Nova Scotia’s $56,374.
The data indicates that Manitoba’s average salary is modest compared to some of Canada’s more affluent provinces.
Income Distribution in Winnipeg Neighborhoods
According to the 2001 Census data, the following table highlights the average and median household incomes for selected neighborhoods:
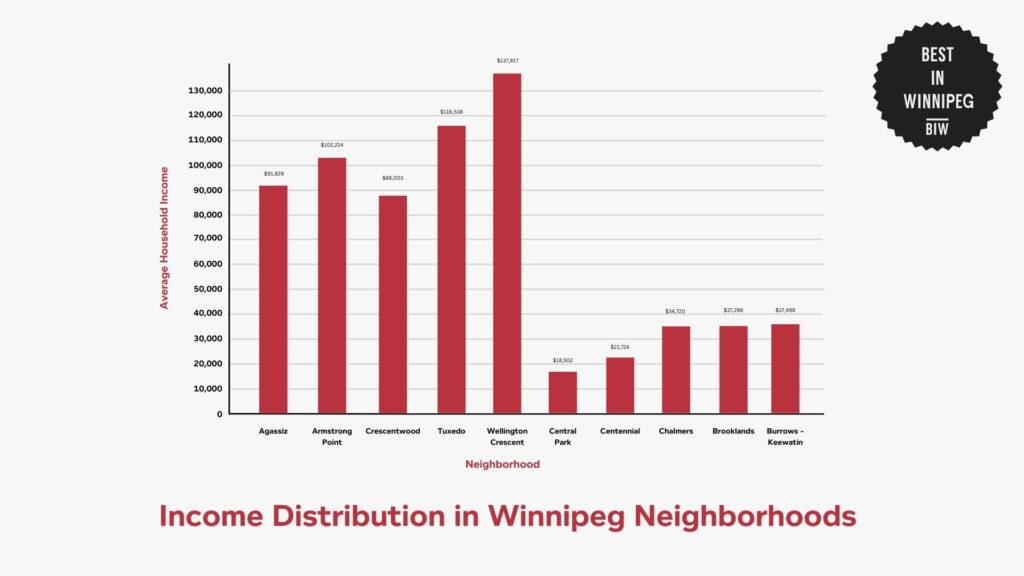
The data reveals significant income disparities among Winnipeg’s neighborhoods. Affluent areas like Wellington Crescent and Tuxedo report average household incomes exceeding $100,000, reflecting concentrations of wealth and higher property values.
In contrast, neighborhoods such as Central Park and Centennial exhibit average household incomes below $25,000, indicating economic challenges and a higher prevalence of low-income households.
Income Distribution Across Demographics in Manitoba
Gender Wage Disparities in Manitoba
A report by the Canadian Centre for Policy Alternatives (CCPA) highlights a persistent gender pay gap in Manitoba, with women earning significantly less than men across various sectors.
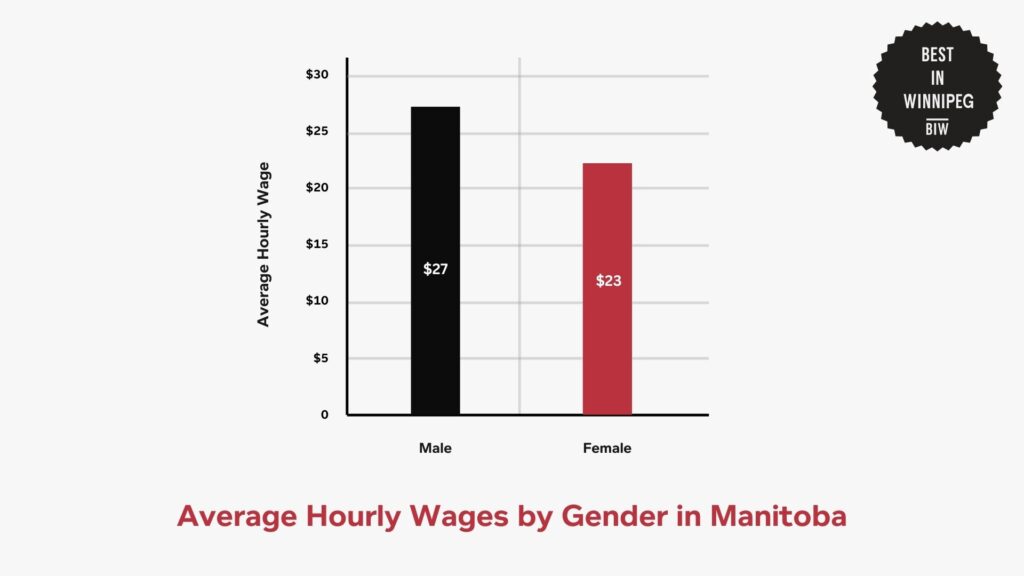
On average, men in the province earn $26.71 per hour, while women earn $22.66 per hour. This amounts to a difference of $4.05 per hour, meaning women earn approximately 85% of what men make in the same amount of time.
Income Distribution Across Age Groups in Manitoba
The following table summarizes data from Statistics Canada and shows the income trends for six age groups in Manitoba in 2022, highlighting key metrics such as aggregate income, average income, and median income:
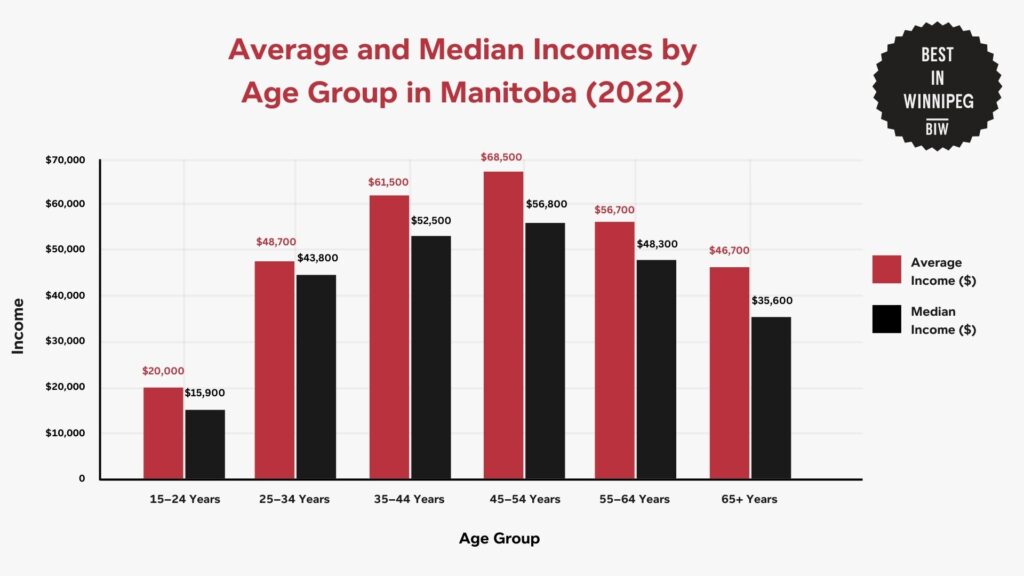
Income levels in Manitoba vary significantly by age group, reflecting the relationship between age, career progression, and retirement.
The highest average income is observed in the 45–54 years age group, where individuals earn an average of $68,500 and a median of $56,800.
Conversely, the 15–24 years and 65+ years age groups show the lowest income levels. The 15–24 years group earns an average of $20,000, reflecting entry-level positions and part-time work.
Meanwhile, the 65+ years group earns an average of $46,700, largely influenced by retirement income and pensions.
Costs and Consequences of Income Inequality in Winnipeg
The 2024 Citizen Satisfaction Survey provides insights into how income disparities and social issues impact the quality of life in Winnipeg. Key findings are summarized in the table below:
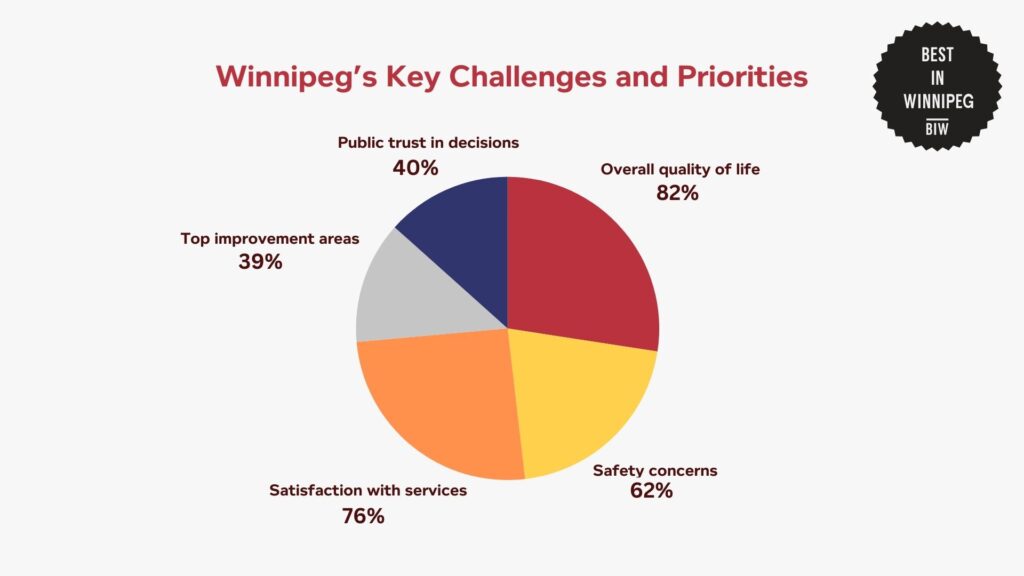
The survey data reflects mixed perceptions of the quality of life and city services in Winnipeg. While 82% of residents rate the city’s overall quality of life positively, specific issues such as safety, infrastructure, and housing highlight areas needing attention.
Satisfaction with city services remains relatively high at 76%, but the identified priority areas, roads, and infrastructure (39%), crime and policing (36%), and housing/social programs (31%), point to critical gaps that directly affect residents’ daily lives.
Interventions and Solutions to Income Inequality in Winnipeg
Tackling income inequality in Winnipeg requires targeted programs that address housing, education, and accessibility. Several existing initiatives and strategies are helping bridge gaps in economic and social equity.
The Manitoba Housing and Renewal Corporation (MHRC) leads efforts to increase affordable housing across Winnipeg.
The Rent Assist Program provides rental subsidies to low-income households, ensuring they spend no more than 30% of their income on rent.
In addition, initiatives like the Winnipeg Housing Rehabilitation Corporation focus on renovating older properties into affordable housing units, addressing the growing demand for low-cost accommodations.
Meanwhile, the Manitoba Jobs and Skills Development Program (JSDP) supports training initiatives tailored to meet the needs of local industries.
This program offers funding for skills upgrading in high-demand sectors like technology, manufacturing, and healthcare.
The Future of Salaries in Winnipeg
The 2023 Economic, Demographic, and Fiscal Outlook for Winnipeg provides projections indicating that the city’s population is expected to grow steadily over the coming years.
Winnipeg’s projected population growth underscores the importance of proactive urban planning and investment in infrastructure.
As the population increases, there will be a heightened need for affordable housing, expanded public transit, and enhanced public services to maintain the quality of life for residents.
Strategic investments and policy decisions made in the coming years will play a pivotal role in shaping Winnipeg’s economic and social landscape, ensuring that the city can accommodate its growing population while fostering development.
References
- CBC News. (2023). Gender pay gap persists in Manitoba: CCPA report. Retrieved from https://www.cbc.ca/news/canada/manitoba/gender-pay-gap-ccpa-report-1.6823570
- Government of Manitoba. (n.d.). About Manitoba Housing. Retrieved from https://www.gov.mb.ca/housing/about/about.html
- Government of Manitoba. (n.d.). Jobs and skills development program contact information. Retrieved from https://www.gov.mb.ca/wd/ites/contact.html
- Statistics Canada. (2023). Table 11-10-0239-01: Income of individuals by age group, sex and income source, Canada, provinces and selected census metropolitan areas. Retrieved from https://www150.statcan.gc.ca/t1/tbl1/en/tv.action?pid=1110023901&pickMembers%5B0%5D=1.10&pickMembers%5B1%5D=2.8&pickMembers%5B2%5D=3.1&pickMembers%5B3%5D=4.1&cubeTimeFrame.startYear=2018&cubeTimeFrame.endYear=2022&referencePeriods=20180101%2C20220101
- Nationwide Visas. (n.d.). Average salary in Canada. Retrieved from https://www.nationwidevisas.com/canada-immigration/average-salary-in-canada/
- Winnipeg.ca. (2001). Income by neighbourhood: Census 2001. Retrieved from https://legacy.winnipeg.ca/Census/2001/Selected%20Topics/Data%20Tables/Income/Income%20by%20Neighbourhood.pdf
- Winnipeg.ca. (2023). 2023 economic, demographic, and fiscal outlook. Retrieved from https://legacy.winnipeg.ca/cao/pdfs/2023-Economic-Demographic-and-Fiscal-Outlook.pdf
- Winnipeg.ca. (2024). 2024 citizen satisfaction survey. Retrieved from https://www.winnipeg.ca/city-governance/documents-reports/2024-citizen-satisfaction-survey
- ZipRecruiter. (n.d.). Average salaries in Winnipeg, MB. Retrieved from https://www.ziprecruiter.com/Salaries/-in-Winnipeg,MB