
Life Expectancy Trends in Winnipeg: A Neighborhood-Level Analysis
Key Insights
- The Winnipeg Regional Health Authority (WRHA) reports that residents in wealthier neighborhoods live an average of 10 years longer than those in lower-income areas.
- The same report also shows that life expectancy varies by gender in Manitoba, with males living an average of 76.73 years and females living 81.71 years, a gap of 4.98 years.
- A study on Community Health Assessment found that premature mortality rates in Winnipeg are significantly higher in low-income areas, with 4.0 deaths per 1,000 residents compared to 1.7 deaths in higher-income neighborhoods.
- Data from Statistics Canada shows that Canadians in the lowest income group are more likely to report poor health compared to those in the highest income group.
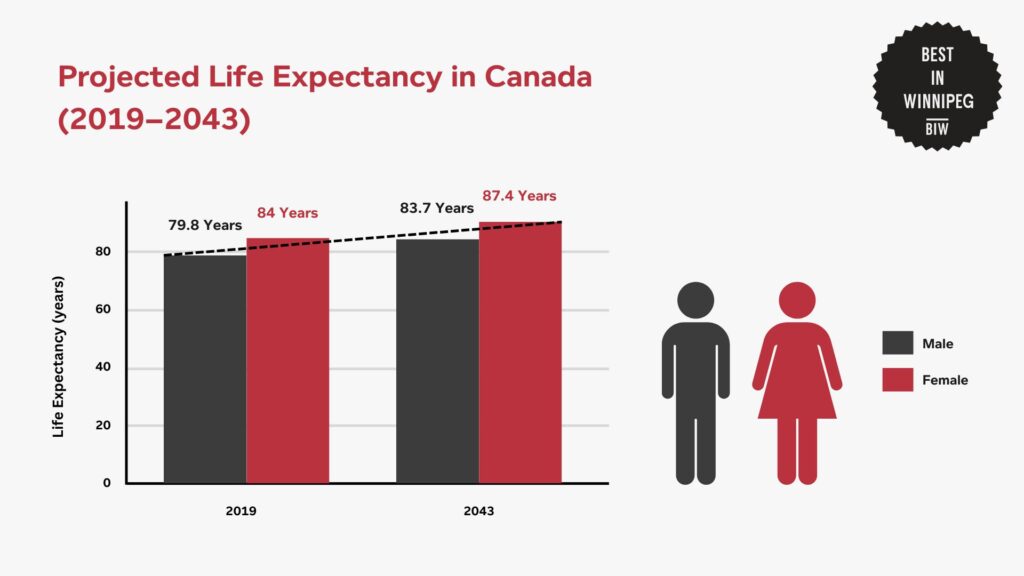
- Under a medium-growth scenario, Statistics Canada estimates that male life expectancy at birth is expected to rise from 79.8 to 83.7 years by 2043, while female life expectancy is anticipated to increase from 84.0 to 87.4 years.
Life expectancy in Winnipeg reveals significant disparities influenced by neighborhood and socioeconomic factors.
According to data from the Winnipeg Regional Health Authority (WRHA), residents of wealthier areas live, on average, a decade longer than those in lower-income neighborhoods.
For instance, residents of Charleswood enjoy an average life expectancy of 83.9 years, while those in Point Douglas face a significantly lower average of 73 years. This 10.9-year gap underscores the stark health inequities present across the city.
Life Expectancy Across Regions in Canada
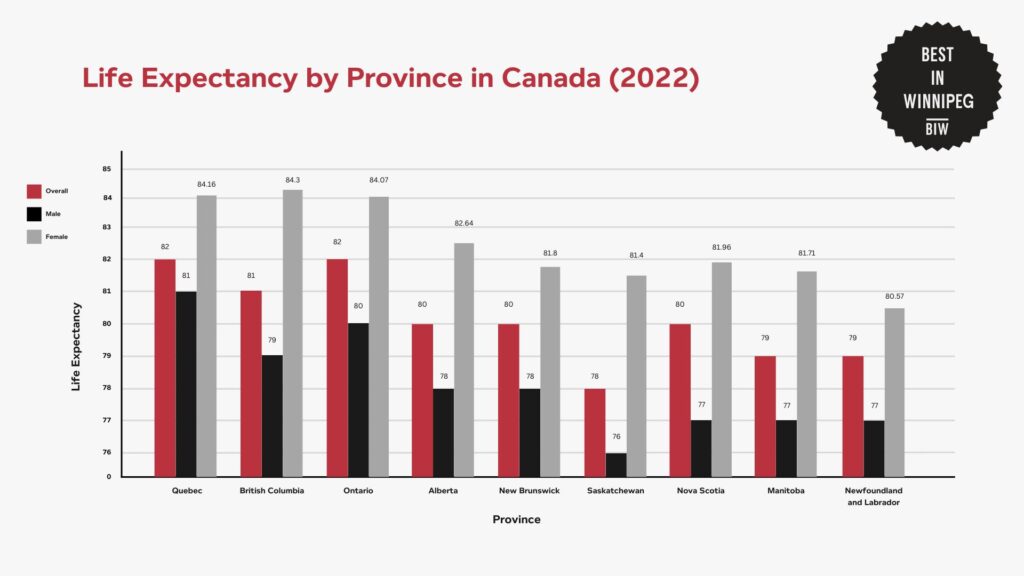
In 2022, Manitoba ranked eighth among provinces, with life expectancy figures significantly influenced by gender and socioeconomic conditions.
Data from Statistics Canada provides insights into life expectancy rates across different regions in Canada.
In 2022, Manitoba ranked eighth among provinces, with life expectancy figures significantly influenced by gender and socioeconomic conditions.
Manitoba’s life expectancy of 79.14 years falls 2.2 years short of the national average of 81.34 years, with males living 76.73 years and females 81.71 years on average. The province’s overall ranking reflects broader challenges, including healthcare access and economic disparities.
In comparison, Quebec leads the nation with an average of 82.48 years, and Newfoundland and Labrador ranks lowest at 78.76 years.
These provincial variations mirror disparities observed within Winnipeg neighborhoods, where socioeconomic factors significantly impact life expectancy.
Life Expectancy in Winnipeg Neighborhoods
Life expectancy across Winnipeg neighborhoods reveals stark disparities, emphasizing the influence of socioeconomic conditions on health outcomes.
According to data from the Winnipeg Regional Health Authority (WRHA), suburban and affluent areas often exceed the provincial average, while central, lower-income neighborhoods fall significantly below.
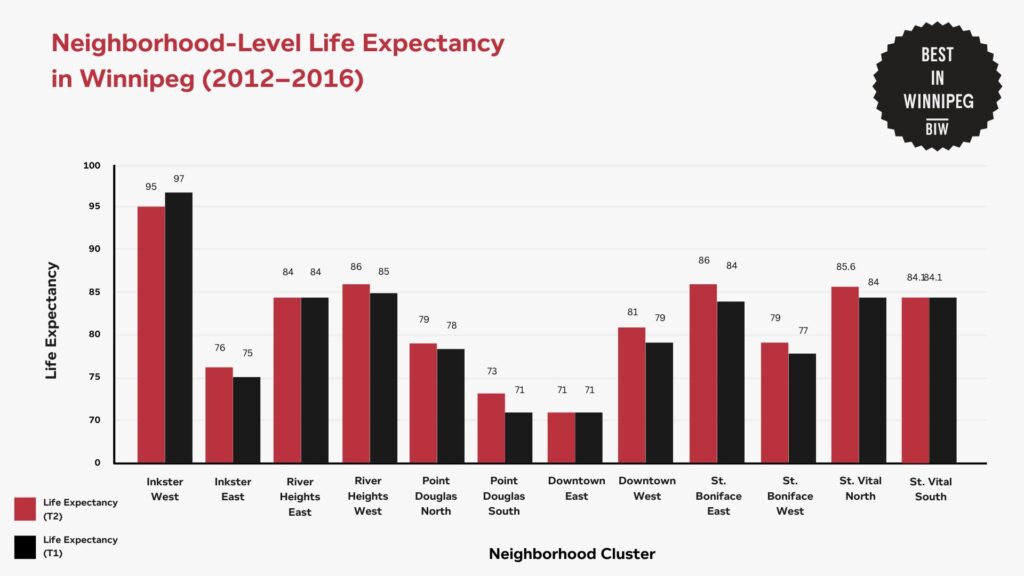
Suburban areas like Inkster West recorded the highest life expectancy at 95.0 years, despite experiencing a 2.0-year decline compared to the previous period of 2007 to 2011.
In contrast, Point Douglas South, the cluster with the lowest life expectancy, improved slightly to 72.5 years. The gap between these clusters exceeds 22 years, underlining the significant health inequities across the city.
Demographic Insights on Life Expectancy
Health outcomes in Winnipeg vary significantly across demographic groups. These differences are evident in key indicators such as premature mortality, infant mortality, and potential years of life lost (PYLL).
The following subsections explore these disparities in detail.
Gender Disparities
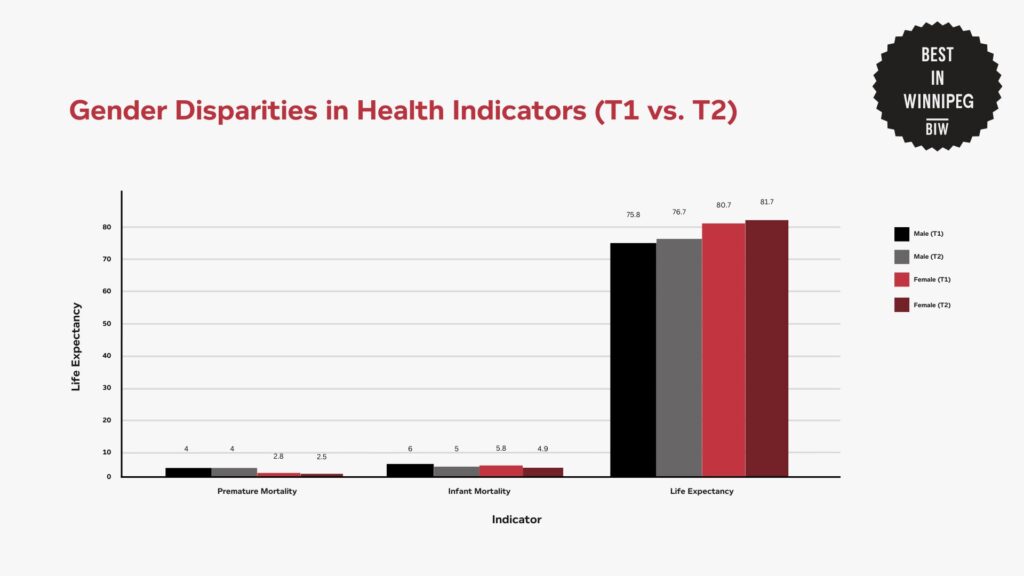
Males in Winnipeg consistently show higher premature mortality rates than females, with a gap of approximately 1.0 deaths per 1,000 population in T2.
Similarly, male infants experience slightly higher mortality rates, though both genders saw significant reductions between T1 and T2. Life expectancy for both genders improved, with males gaining 0.9 years and females gaining 1.0 years.
Income Disparities
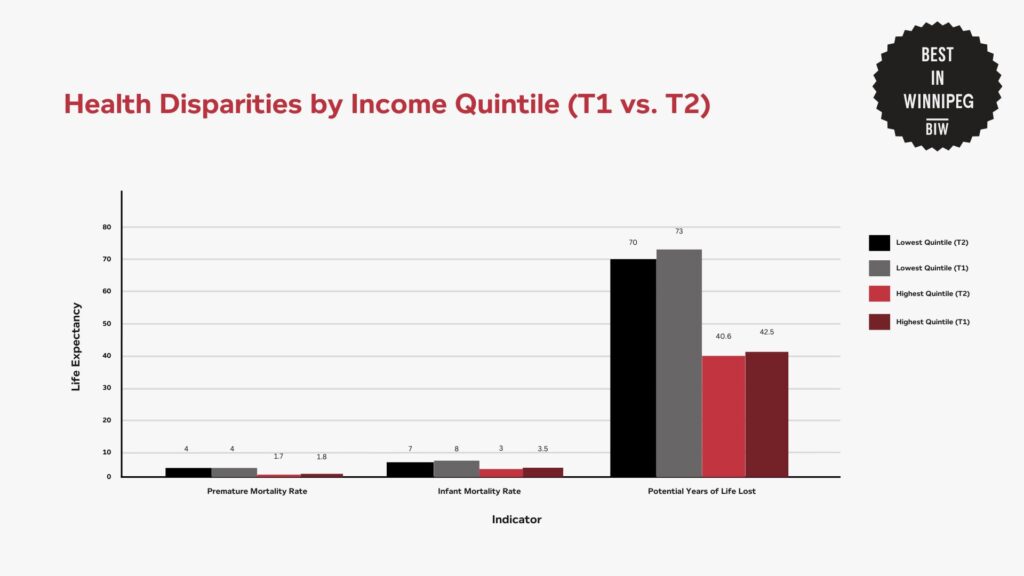
Health outcomes improve significantly with rising income levels, as demonstrated by the data. Residents in the lowest-income areas face 2 to 3 times higher rates of mortality and PYLL compared to those in the highest-income areas.
While gaps narrowed slightly between T1 and T2—such as the reduction in infant mortality from 4.0 to 3.7 deaths per 1,000 live births—the disparities remain considerable.
Age Disparities
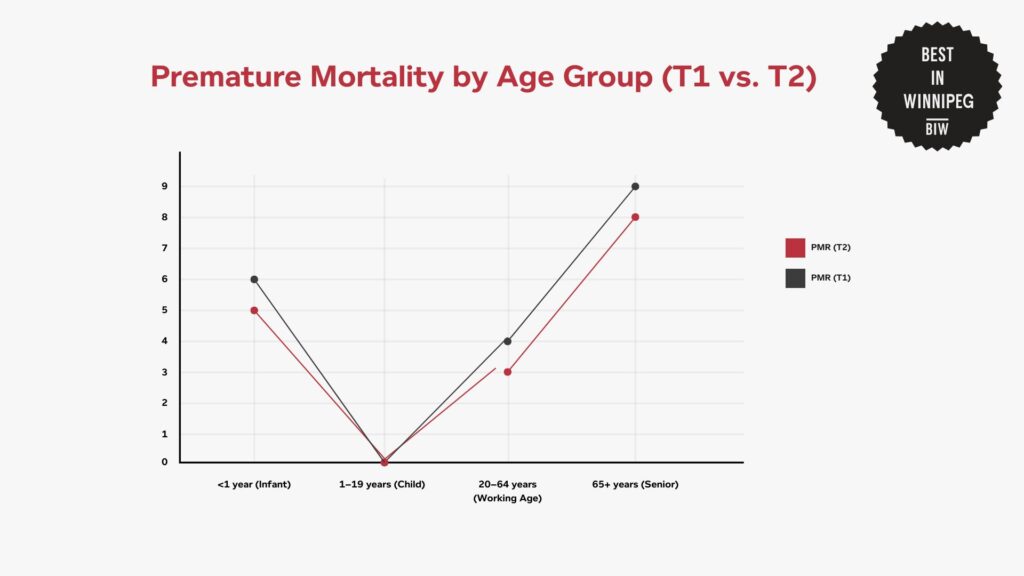
Infant mortality shows the greatest improvement, with a reduction of 1.0 deaths per 1,000 live births from T1 to T2.
Premature mortality for working-age and senior populations also declined by 0.3 deaths per 1,000 population, indicating broader health improvements across all age groups.
However, seniors remain the most affected demographic, with PMR significantly higher than any other age group.
Costs and Consequences of Life Expectancy Inequalities
Disparities in life expectancy across Winnipeg’s neighborhoods have profound economic and social implications. These gaps not only reflect health inequities but also contribute to broader societal challenges.
For instance, Statistics Canada reported that Canadians in the lowest income group are more likely to report poor health compared to those in the highest income group.
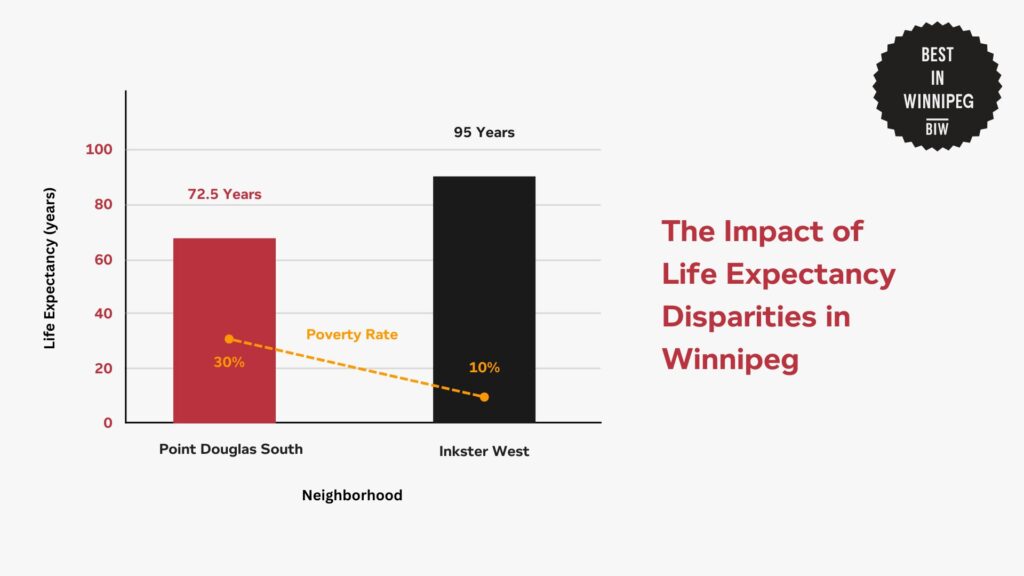
In Winnipeg, neighborhoods with the lowest life expectancy, such as Point Douglas South (72.5 years), coincide with poverty rates exceeding 30%.
This is in contrast to the rate of around 10% in higher-income areas like Inkster West, which boasts a life expectancy of 95 years.
Furthermore, significant differences in life expectancy can erode social cohesion and contribute to disparities in quality of life.
Interventions and Solutions to Life Expectancy Inequalities
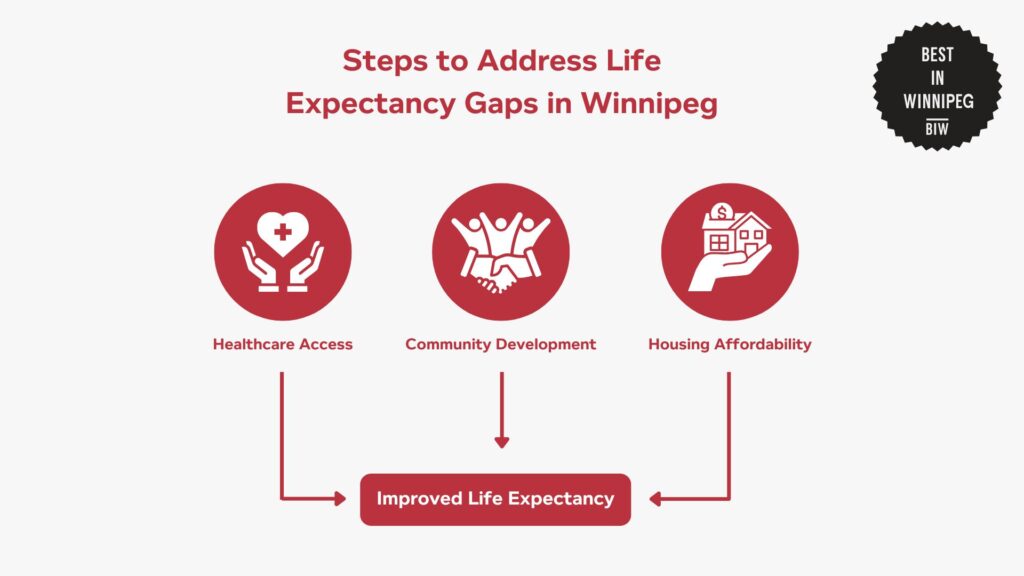
Efforts to address life expectancy disparities in Winnipeg focus on tackling the social determinants of health.
Programs like the Winnipeg Regional Health Authority’s Health Equity Promotion aim to improve access to healthcare, affordable housing, and community services in low-income neighborhoods.
Investments in early childhood education and employment training have also been linked to better health outcomes and reduced poverty rates.
Future Trends in Life Expectancy
According to Statistics Canada, under a medium-growth scenario, male life expectancy at birth is expected to rise from 79.8 years in 2019 to 83.7 years by 2043, while female life expectancy is anticipated to increase from 84.0 years to 87.4 years.
However, without targeted interventions addressing socioeconomic disparities, certain neighborhoods may continue to experience lower life expectancy compared to more affluent areas.
References
- Winnipeg Regional Health Authority. (n.d.). Community health assessment. Retrieved from https://wrha.mb.ca/research/community-health-assessment/
- Statistics Canada. (n.d.). Table: Life expectancy and other elements of the life table, Canada, all provinces except Prince Edward Island, and territories. Retrieved from https://www150.statcan.gc.ca/t1/tbl1/en/tv.action?pid=1310040901
- Public Health Agency of Canada. (n.d.). Summary: Direct economic burden of socio-economic health inequalities in Canada. Retrieved from https://www.canada.ca/en/public-health/services/publications/science-research-data/summary-direct-economic-burden-socio-economic-health-inequalities-canada.html
- Winnipeg Regional Health Authority. (n.d.). Health equity promotion. Retrieved from https://wrha.mb.ca/public-health/service/health-equity-promotion/
- Statistics Canada. (n.d.). Population projections for Canada (2018 to 2068), provinces and territories (2018 to 2043). Retrieved from https://www150.statcan.gc.ca/n1/pub/91-620-x/91-620-x2022001-eng.htm