
Winnipeg Immigration Statistics Telling a Story of Growth and Change
Key Insights
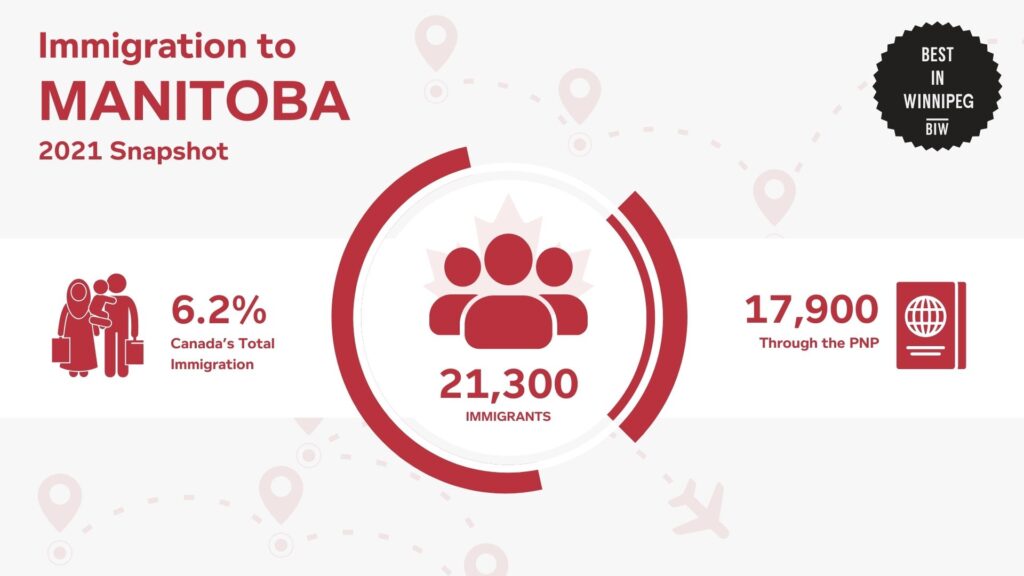
- Manitoba Immigration Facts Report 2021 reveals that Winnipeg welcomed over 21,300 immigrants in 2021, accounting for 6.2% of all immigration to Canada that year.
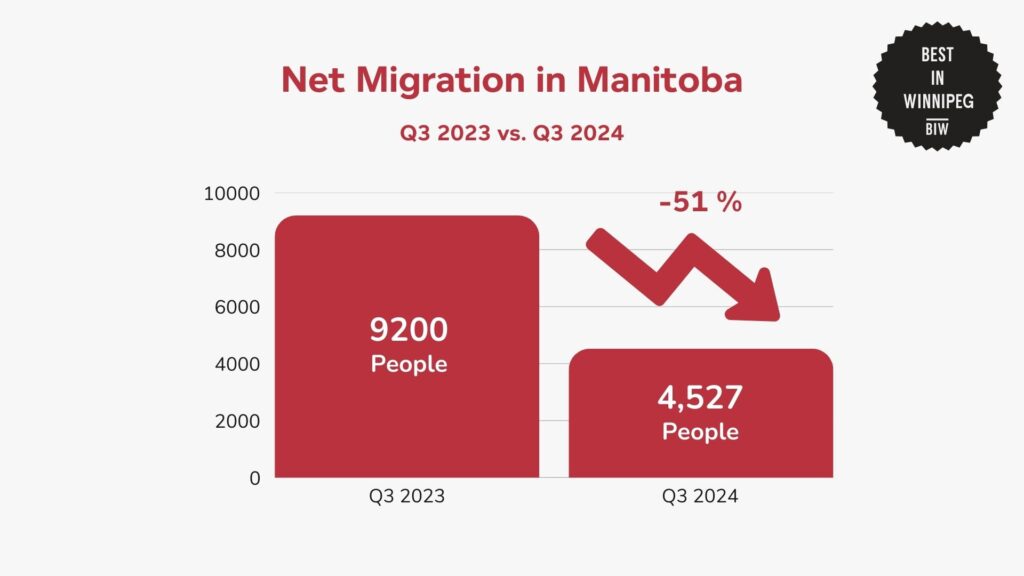
- The Canadian Real Estate Association reported that Manitoba experienced a net population increase of 4,527 people in Q3 2024, primarily driven by international immigration.
- Demographic data from Statistics Canada reveals that 61% of Winnipeg’s immigrant population falls within the working-age group of 25–54, reflecting the city’s emphasis on attracting skilled workers.
- Housing affordability challenges are pronounced in immigrant-dense neighborhoods like Downtown Winnipeg, where average rents rose by 22% between 2016 and 2021, as noted in the 2021 Census of Population.
- Economic contributions by immigrants include over 65,000 participating in Winnipeg’s workforce, and an estimated $180 million in annual tax contributions, according to Statistics Canada.
Winnipeg continues to play a pivotal role in Manitoba’s immigration landscape, with the Manitoba Immigration Facts Report 2021 showing that the province welcomed over 21,300 immigrants in 2021 alone.
This accounted for 6.2% of all immigration to Canada that year, underscoring the city’s importance as a hub for newcomers.
The same report also showed that in 2021, over 23% of Manitoba’s population was foreign-born, and Winnipeg remains the primary settlement destination, attracting diverse communities from around the globe.
The Canadian Real Estate Association reported that Manitoba experienced a net increase of 4,527 people in the third quarter of 2024, as shown in the data. This growth was driven primarily by positive international immigration.
However, the net migration figure represents a 51% decline compared to the third quarter of 2023, when Manitoba recorded a net increase of approximately 9,200 people, reflecting a notable decrease in overall population growth momentum.
Historical Immigration Trends and the Role of Manitoba’s Provincial Nominee Program (PNP)
Manitoba’s immigration patterns have undergone significant transformations over the decades, driven by evolving policies and global migration trends.
Data from the Manitoba Immigration Facts Report 2021 reveals that between the 1970s and early 1990s, the province struggled to retain and attract residents.
Manitoba often recorded negative net migration, with quarterly losses reaching as low as -5,000 people in some years.
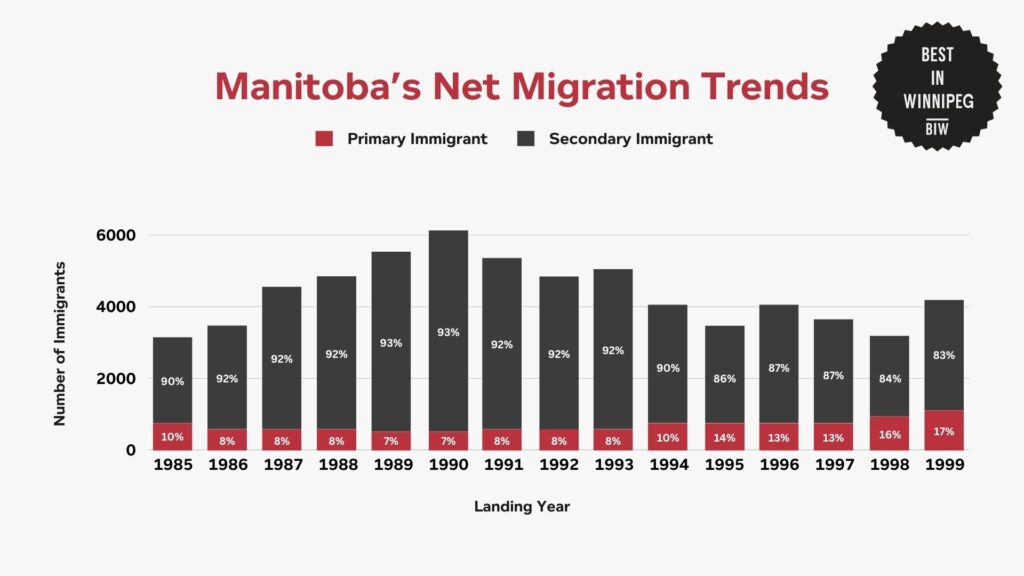
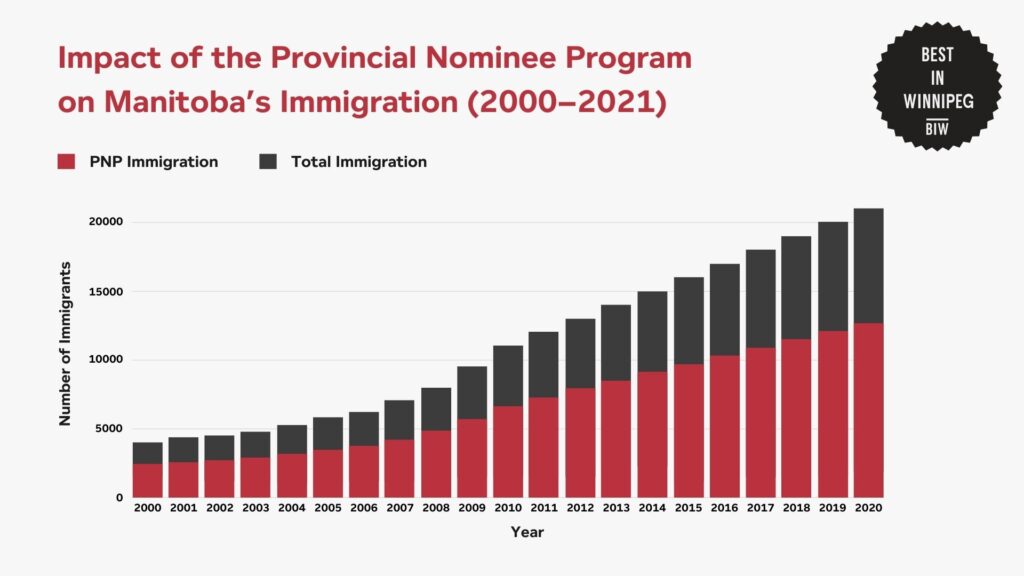
The late 1990s marked a turning point for Manitoba, with the introduction of the Provincial Nominee Program (PNP) in 1998. The PNP was created to address labor shortages by attracting skilled workers and their families.
By 2000, Manitoba’s annual immigration numbers exceeded 4,000 for the first time in nearly two decades, signifying the program’s early success.
Over the years, the PNP has become the backbone of Manitoba’s immigration strategy, contributing to over 90% of the province’s economic class arrivals annually.
By 2021, the program facilitated the arrival of 17,900 immigrants, representing 84% of Manitoba’s total immigration for the year.
Through a combination of historical resilience and strategic programs like the PNP, Manitoba has evolved from a province grappling with population losses to one of Canada’s leading immigration hubs.
Regional Analysis of Migration Trends Across Regions in Canada
Manitoba’s interprovincial migration trends underscore a key demographic challenge.
According to data from the Migration Policy Institute, in Q3 2024, the province recorded a net loss of 1,200 residents to other provinces, driven by outflows to Alberta and British Columbia.
A Regional Analysis of Migration Trends in Canada also reveals the number of international immigration and net interprovincial migrants per region in 2023.
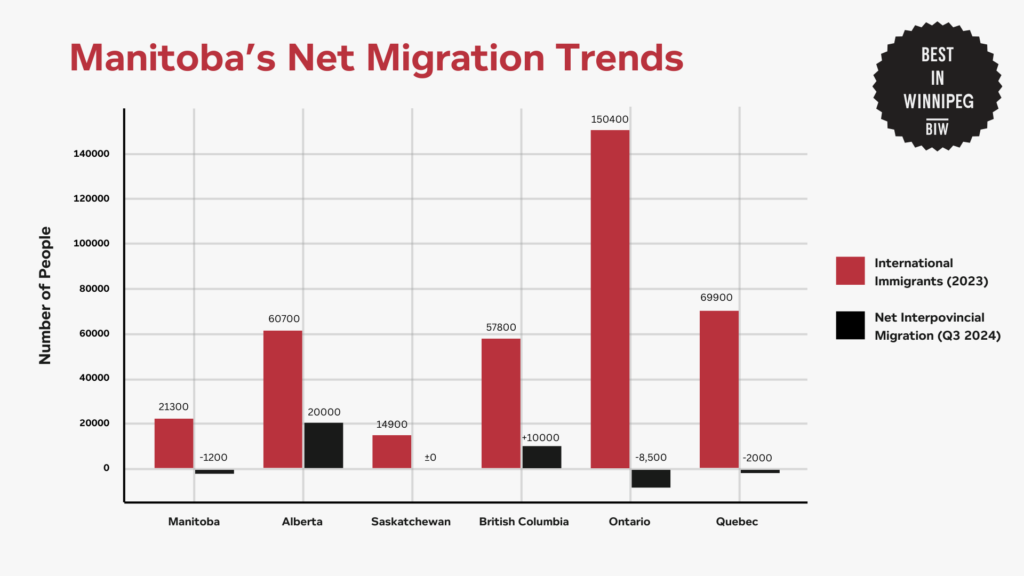
This table highlights notable differences in immigration and migration trends across Canadian provinces. Manitoba, for instance, attracted 21,300 international immigrants in 2023, emphasizing its strength as a destination for newcomers.
However, it experienced a net loss of 1,200 residents in interprovincial migration during Q3 2024, revealing challenges in retaining its population.
In contrast, Alberta and British Columbia recorded positive gains in both international and interprovincial migration, reinforcing their appeal as top destinations for migrants within Canada.
Meanwhile, Ontario and Quebec show high international immigration figures but face significant losses to interprovincial migration, reflecting regional economic and lifestyle disparities.
Immigrant Population in Winnipeg Neighbourhoods
Data from Statistics Canada reveals substantial variation across neighborhoods.
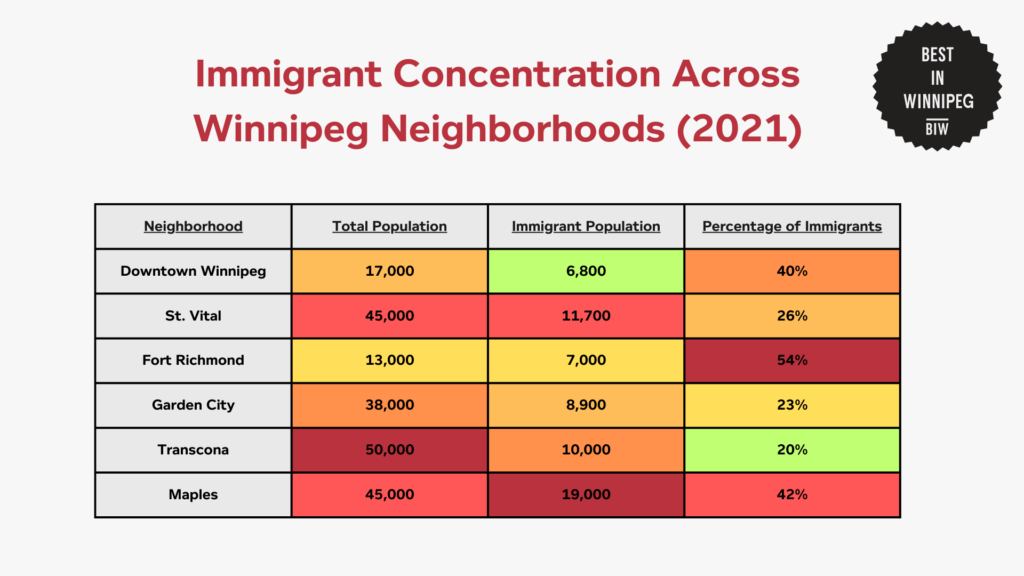
Immigration patterns within Winnipeg reveal substantial variation across neighborhoods. Areas such as Fort Richmond and The Maples exhibit the highest concentrations of immigrants, with 54% and 42% of their populations being foreign-born, respectively.
Downtown Winnipeg, a hub for economic and cultural activity, also attracts a significant share, with immigrants comprising 40% of its population.
In contrast, suburban areas like Transcona and Garden City have lower immigrant proportions, at 20% and 23%, respectively.
Demographic Breakdown of Immigrants in Winnipeg
A report by Statistics Canada shows how Winnipeg’s immigrant population is diverse and reflects a wide range of age groups, genders, and ethnic origins.
This part illustrates how these demographics form the population of immigrants in Winnipeg.
Age Distribution Among Immigrants in Winnipeg
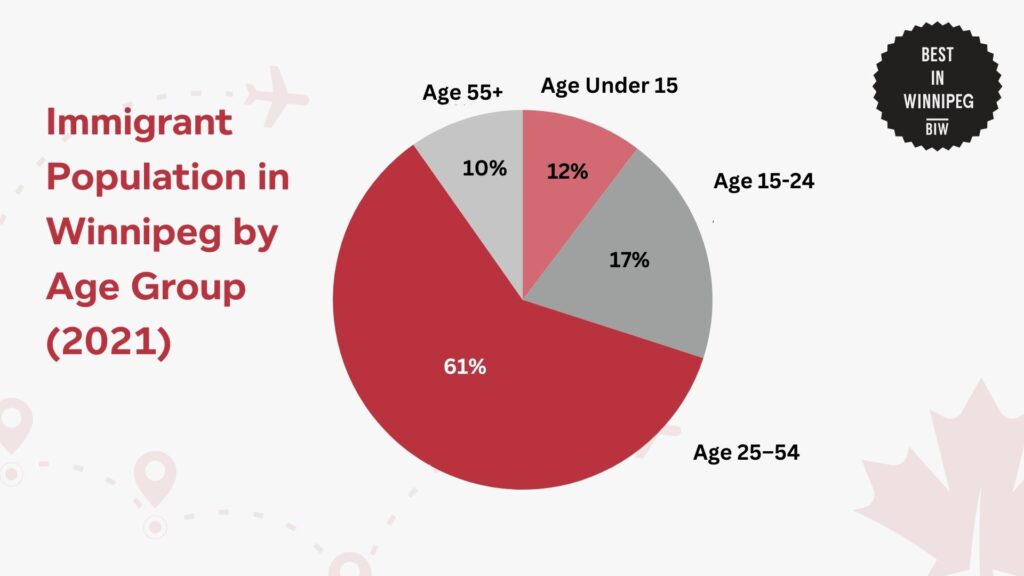
Winnipeg’s immigrant population is predominantly working-age adults, with 61% falling within the 25–54 age group. This reflects the city’s strategic focus on attracting skilled workers through programs like the Provincial Nominee Program.
Young immigrants under 15 make up 12%, driven by family reunifications, while older immigrants (55+) account for a smaller share at 10%.
Gender Composition of Immigrant Population in Winnipeg
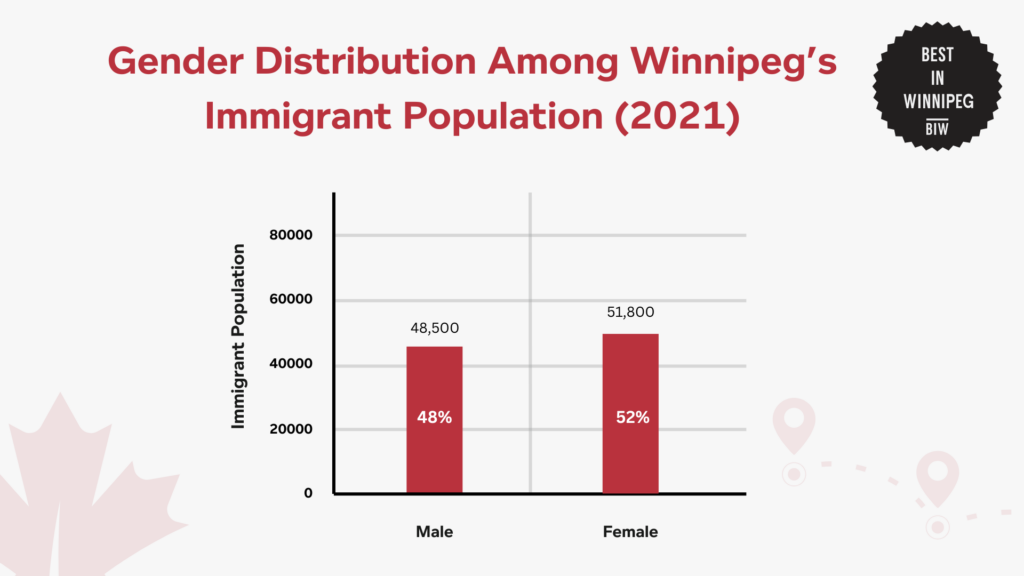
Winnipeg’s immigrant population comprises 52% females and 48% males, reflecting a near-equal gender distribution.
The slight female majority aligns with global migration trends, particularly in family reunification cases, where women are often the principal applicants or caregivers.
Ethnic Origins of Immigrants in Winnipeg
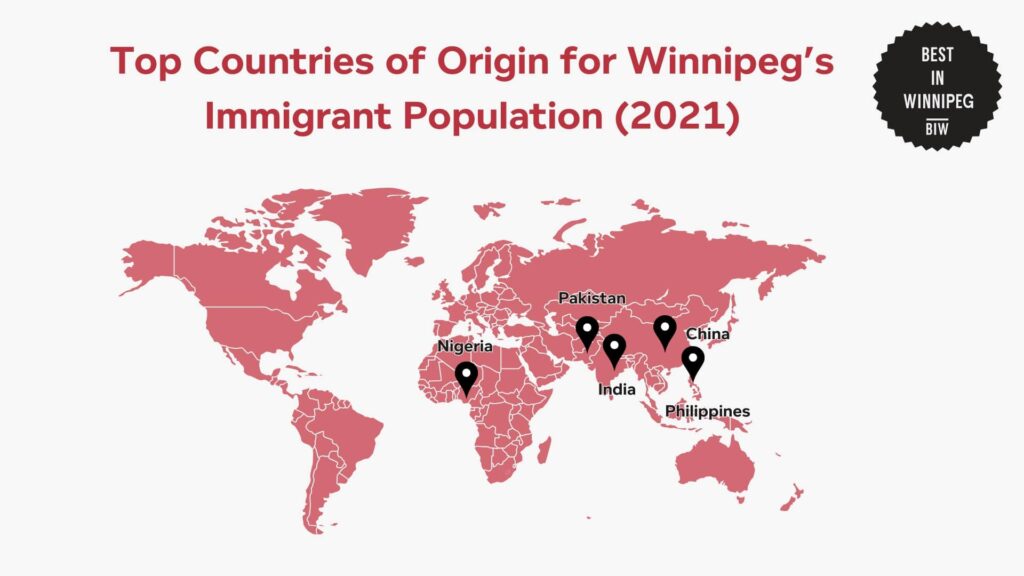
The Philippines leads as the top country of origin for immigrants in Winnipeg, accounting for 26% of the city’s immigrant population.
India (16%) and China (10%) also contribute significantly, reflecting Manitoba’s targeted immigration streams for skilled professionals from these regions.
Emerging communities from Nigeria (5%) and Pakistan (5%) highlight growing diversity in the city’s demographic makeup.
Costs and Consequences of Immigration in Winnipeg
The rise in immigration has contributed to increased housing demand, particularly in neighborhoods with higher immigrant concentrations.
Data from the 2021 Census of Population in Winnipeg indicates that areas like The Maples and Fort Richmond, which attract many newcomers, have seen notable increases in housing prices and rental rates.
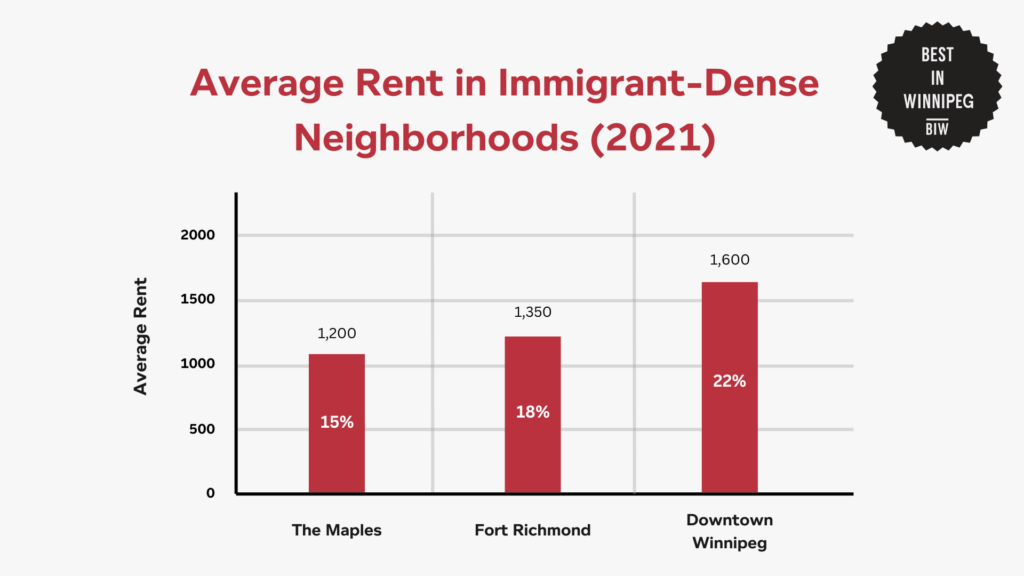
Housing affordability is a pressing issue in Winnipeg, exacerbated by the influx of newcomers. Neighborhoods with high immigrant populations have experienced significant rental increases, such as a 22% rise in Downtown Winnipeg between 2016 and 2021.
These trends highlight the need for targeted housing policies to ensure newcomers can find affordable housing without straining existing residents.
Meanwhile, Statistics Canada highlights labor market participation among immigrants.
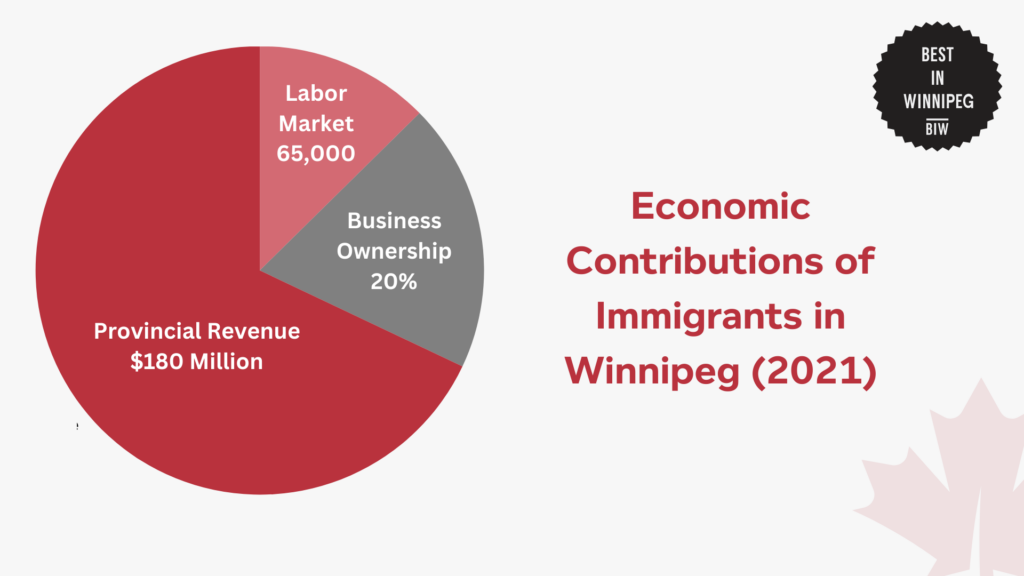
Immigrants play a vital role in Winnipeg’s economy, with over 65,000 contributing to the workforce and 20% owning small and medium-sized enterprises (SMEs). Their annual tax contributions, estimated at $180 million, bolster provincial revenue.
Interventions and Solutions to Housing Issues Caused by Immigration in Winnipeg
As Winnipeg continues to attract immigrants, addressing integration challenges is critical to ensuring both economic and social benefits.
The Manitoba government collaborates with the Canada Mortgage and Housing Corporation (CMHC) under the National Housing Strategy, which allocates funding to increase affordable housing units for vulnerable groups, including immigrants.
This strategy, launched in 2017, is Canada’s first-ever national approach to housing, aiming to reduce chronic homelessness by 50% and increase affordable housing stock nationwide.
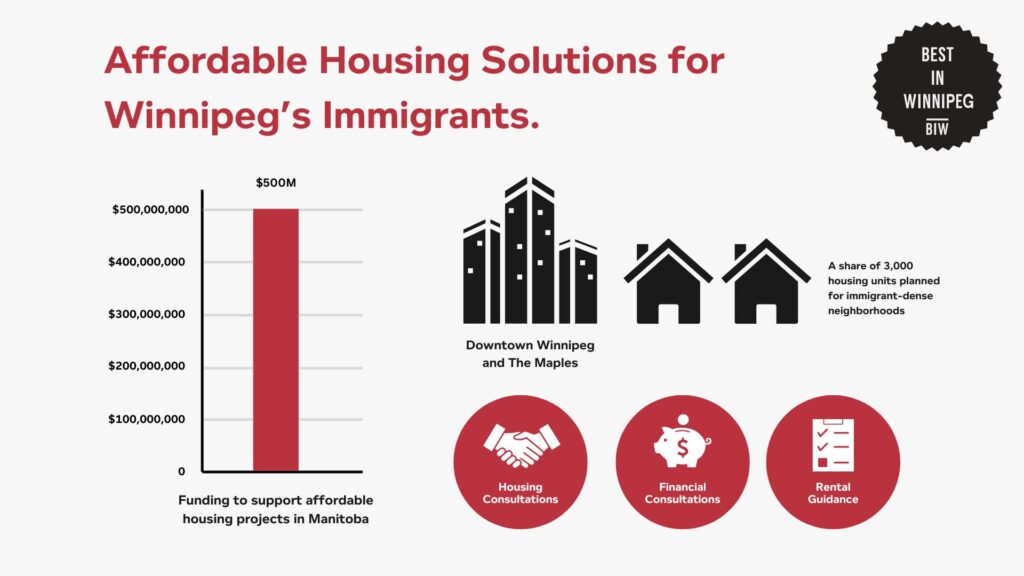
In Winnipeg, significant funding is directed toward constructing and renovating affordable housing units specifically for vulnerable populations, including low-income immigrants.
Under the National Housing Strategy, over $500 million has been allocated to Manitoba to support affordable housing projects, addressing the needs of vulnerable populations, including immigrants.
As part of this initiative, 3,000 new housing units are being planned across the province, with a significant share dedicated to immigrant-dense neighborhoods in Winnipeg, such as Downtown Winnipeg, The Maples, and Fort Richmond.
Future Trends for Immigration, Housing, and Economic Activity in Winnipeg
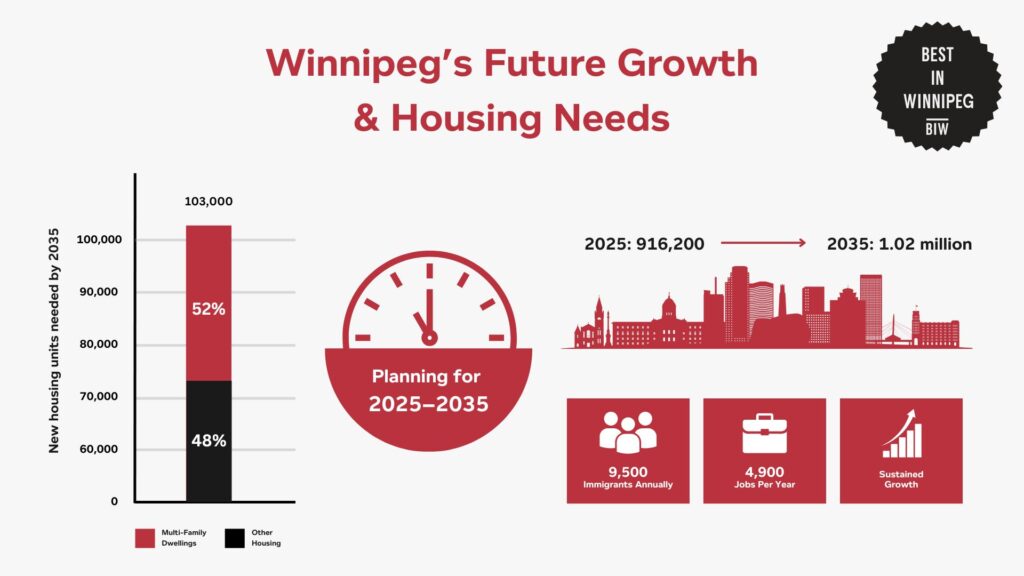
Winnipeg’s population growth is expected to remain steady, with the City of Winnipeg reporting that the city’s Census Metropolitan Area (CMA) is projected to reach 1.02 million residents by 2035.
This represents an average annual growth rate of 1.2%, driven primarily by international immigration.
Meanwhile, housing demands are also expected to rise sharply. By 2035, Winnipeg will require 103,000 additional housing units, with multi-family dwellings accounting for 52% of new developments.
Reports from the Conference Board of Canada highlight that immigration will remain a cornerstone of Winnipeg’s economic stability.
Immigrant workers are projected to fill key labor market gaps, with 4,900 new jobs created annually in sectors such as healthcare and manufacturing.
References
- Government of Manitoba. (2021). Manitoba Immigration Facts Report 2021. Retrieved from https://immigratemanitoba.com/data/facts-report-2021/
- Canadian Real Estate Association. (n.d.). Net migration in Manitoba: Q3 2023 vs. Q3 2024. Retrieved from https://stats.crea.ca/board/winn-migration
- Migration Policy Institute. (n.d.). Canada resource page. Retrieved from https://www.migrationpolicy.org/country-resource/canada
- Statista. (n.d.). Number of immigrants in Canada. Retrieved from https://www.statista.com/statistics/444906/number-of-immigrants-in-canada/
- Statistics Canada. (n.d.). Start page. Retrieved from https://www.statcan.gc.ca/en/start
- Statistics Canada. (2021). Census of population: Immigration and citizenship. Retrieved from https://www12.statcan.gc.ca/census-recensement/2021/as-sa/fogs-spg/page.cfm?lang=E&topic=9&dguid=2021S0503602
- Statistics Canada. (2021). Census profile: Winnipeg. Retrieved from https://www12.statcan.gc.ca/census-recensement/2021/dp-pd/prof/details/page.cfm?Lang=E&SearchText=Winnipeg&DGUIDlist=2021S05101036&GENDERlist=1,2,3&STATISTIClist=1&HEADERlist=0
- Canadian Alliance to End Homelessness. (2021). Budget 2021 analysis. Retrieved from https://caeh.ca/budget-2021-analysis/
- City of Winnipeg. (n.d.). Population forecast for Winnipeg. Retrieved from https://legacy.winnipeg.ca/cao/pdfs/population_forecast.pdf
- Conference Board of Canada. (2024). Major city insights: Winnipeg. Retrieved from https://www.conferenceboard.ca/in-fact/major-city-insights-winnipeg_jul2024/